Visual Materials
Organization charts
You might also be interested in
Image not available
Maps, charts, drawings
Visual Materials
Photographs of maps, charts and drawings depicting organization charts, instruments, load charts, revenue curves, peak demand, hydroelectric development, Edison properties timeline, transmission systems, hydroelectric and steam plant statistics, district service records, comparison charts, street lighting tables, ammonia charts, calcium brine charts, and wire tables.
photCL SCE

C1.1 - Charts miscellaneous
Visual Materials
C1.1 - Charts miscellaneous - Chart of Daily Load Curves 12/24/15 "B.T.P."
photCL SCE 02 - 03333

C1.1 - Charts miscellaneous
Visual Materials
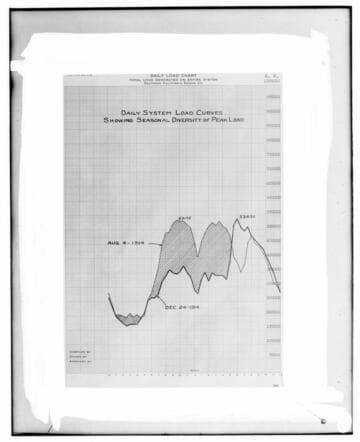
C1.1 - Charts miscellaneous - Chart of Daily Load Curves 8/14 & 12/24 "B.T.P."
photCL SCE 02 - 03336

C1.1 - Charts miscellaneous
Visual Materials
C1.1 - Charts miscellaneous - Chart of Daily Load Curves 8/14 & 12/24 "B.T.P."
photCL SCE 02 - 03334
C1.1 - Charts miscellaneous
Visual Materials
C1.1 - Charts miscellaneous - Chart of Daily Load Curves 8/14 & 12/24 "B.T.P."
photCL SCE 02 - 03335

C1.1 - Charts miscellaneous - Load Chart
Visual Materials
C1.1 - Charts miscellaneous - Load Chart - Estimated load on system (for John B. Miller).
photCL SCE 02 - 13072